|
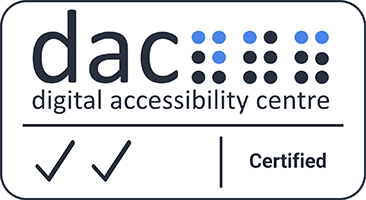
Spending Headlines (January 2023) |
Essentials |
Non-essentials |
|
Monthly Change (vs December 2022) |
2% |
-11% |
|
Annual Change (vs January 2022) |
11% |
11% |
|
Total spending |
£4.43bn |
£2.91bn |
Year-on-year consumer spending rose by 10 per cent in January as significant spikes in energy, supermarket and holiday spend helped pump up essential and discretionary costs, according to Nationwide’s latest Spending Report1.
But research2 looking into rising costs reveals seven in ten (70%) people are worried3 about the state of their personal finances and ability to cover essential costs, with almost two thirds (65%) worried about keeping up with their utility bills.
Nationwide’s monthly Spending Report analysed nearly 215 million debit card, credit card and Direct Debit transactions made by the Society’s members between 1 and 31 January 2023.
While spending in January was considerably higher than the previous year, it was still down two per cent compared to the previous month (December 2022) as is often the case in the post-festive month. In fact, January spending is normally lower than that seen in December. The number of transactions made by members was also up 10 per cent year-on-year, yet down 10 per cent on the number made in December 2022.
Breaking down the total spend, there was an 11 per cent year-on-year increase in both essential and discretionary spending, with a respective 11 and 10 per cent increase in transactions. However, month-on-month, spending on essential items rose by two percent, while non-essential spending reduced by 11 per cent – reflecting the impact of rising costs at a time of year when many are repaying debt. Credit card payments and debt repayments were both 13 per cent higher in January compared to 12 months ago.
Non-essential transactions were also 10 per cent higher than January last year, perhaps reflecting the fact that Covid restrictions were in place for much of January 2022. However, they were 14 per cent lower than December 2022.
Nationwide’s separate monthly poll2 of more than 2,000 people across the UK uncovers a range of consumer concerns in light of the current cost-of-living crisis. Among the 70 per cent worried3 about the state of their finances and their ability to cover essential costs, more than one in five (23%) admit to being extremely worried. These levels of concern are consistent with last month (69% and 23% respectively). These concerns are most prevalent amongst those living in the private rented sector and in social housing (in both 82% are worried3), while nearly three quarters (72%) of those with a mortgage are worried3.
Nationwide’s poll suggests that paying utility bills (energy, water) are the most worrying for people. Nearly two thirds (65%) admitted they are worried about these payments, with a third (33%) concerned about credit card repayments. Other payments worrying people in January were:
- Tax payments (e.g., council tax, HMRC): 39%
- Rent payments: 27%
- Mortgage payments: 23%
- Loan repayment: 22%
Essential spending overview (full data by category in table below): Nearly all essential categories saw increased spending compared to January last year, perhaps reflective of rising costs and inflation. Utilities (+37%), travel via public transport (+32%), tax payments (+17%) and mortgage payments (+17%) fuelled annual growth in spending. By far the biggest category for spending – supermarkets – recorded a 10 per cent year-on-year increase due to inflation. Credit card and other debt repayments increased six per cent and 26 per cent respectively versus December. Despite a small month-on-month rise in essential spending overall, there was a fall of 21 per cent in supermarket spending and 43 per cent fall in discount stores compared to December as festivities ended.
Money left over after essential spending cost covered
According to Nationwide’s poll, three in ten (30%) have £100 or less of their monthly income to spend on non-essential items once all essential costs have been covered. However, six per cent have nothing left. Four in ten (40%) have between £101 and £500 left for discretionary spending, with 11 per cent having between £501 and £1,000.
Non-essential spending overview (full data by category in table below): Airlines (+68%), holidays (+43%), clothing and shoes (+14%), eating and drinking out (+14%) and digital goods (+13%) were the top five areas propping up the 11 per cent increase in year-on-year discretionary spending. The 11 per cent monthly fall was largely due to cutbacks in spending on clothing and shoes (-37% vs Dec), general retailers and department stores (-32% vs Dec), health and beauty (-19% vs Dec) and eating and drinking out (-15% vs Dec). January did, however, record an uptick in monthly spending on holidays (+47% vs Dec) and airline travel (+96% vs Dec) as people look to start 2023 by booking a holiday for this year. Annual growth in spending on both categories demonstrates the rising cost of travelling and taking a holiday, accounting for nearly 14 per cent of all non-essential spend.
Booking a holiday for this year?
According to Nationwide’s separate poll, nearly two in five (39%) people say they have already booked a holiday either in the UK or abroad for this year, reinforcing why there has been an uptick in spending in January on holidays and travel. That rises to nearly half (48%) of those aged 18-34, while only 31 per cent of those aged between 45 and 54 say they have already planned and booked their trip abroad. The North West (46%) and North East (44%) are the regions where people are most likely to have already booked a holiday for this year, whereas those in the South West (31%) and Wales (35%) are least likely to have already done so.
Eating and drinking out
Nationwide’s member data shows that spending on eating and drinking out fell 15 per cent month-on-month in January, with the number of transactions down 10 per cent. However, the number of transactions and total spending were both 14 per cent higher than in January 2022 when the UK was still under some Covid restrictions.
The month-on-month 15 per cent reduction in spend on eating and drinking was mirrored in the Society’s consumer research, with more than a quarter (27%) not eating and drinking out at all in January. A further 25 per cent said they did so only once, while 22 per cent did so twice during the month. Nearly a quarter (23%) said they ate or drank out three or more times during January.
Nationwide’s supermarket cashback
As part of the Society’s cost of living support for its members, Nationwide is giving current account members4 £100 million of cashback in supermarkets5. The 5% cashback applies to both online and instore spending made using a Nationwide debit card at both large and small supermarkets6 between 9 February and 30 April7. The cashback is capped at £10 per calendar month, per card, meaning members will receive the monthly maximum by spending £200.
Mark Nalder, Payments Strategy & Performance Director at Nationwide Building Society, said: “We often see a month-on-month drop in January as spending falls back from the elevated levels seen in December, but also as people look to start the New Year by reining in their discretionary spending. This is reinforced through our consumer research, which highlights ongoing concerns among consumers about their finances and their ability to cover essential costs at a time when the cost of living remains high. One key part of essential spending is in supermarkets with the amount spent by the Society’s members up 10 per cent on last January, reflecting the increased price of food and drink. To help our members where we can, we’re offering up to £10-a-month cashback on supermarket spending.
“But it’s not all doom and gloom. Despite worries, the nation is preparing for warmer weather and one area of non-essential spending where there has been a significant uptick in January is holidays and travel, as people look to plan ahead and book some time away from home during this year.”
-ends-